UPDATE: Wednesday, March 3rd, 2010
Today is an interesting weather day. It is also a good day to demonstrate the use of the Integration of Aviation AWOS with RWIS application. Take a look at the following screenshots:
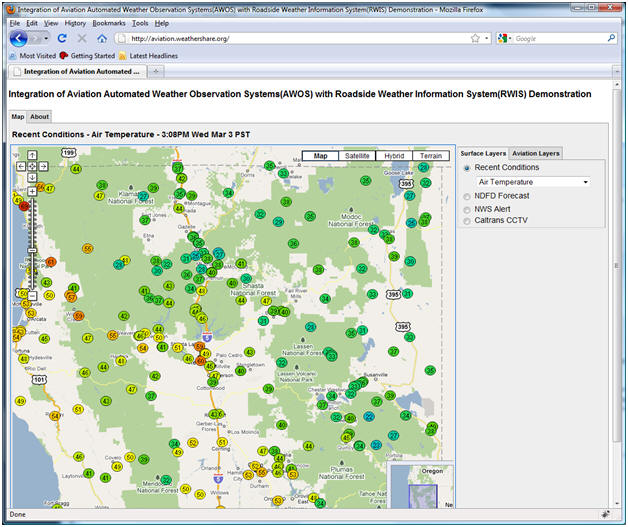
Here's the Integration of Aviation AWOS with RWIS home page. By default, you'll see current surface conditions - in this case, temperature. We're using the same data as we use in WeatherShare, so if you've used WeatherShare before, this will look familiar to you. Note the mix of temperatures, including many near or below freezing - not unusual for this time of year:
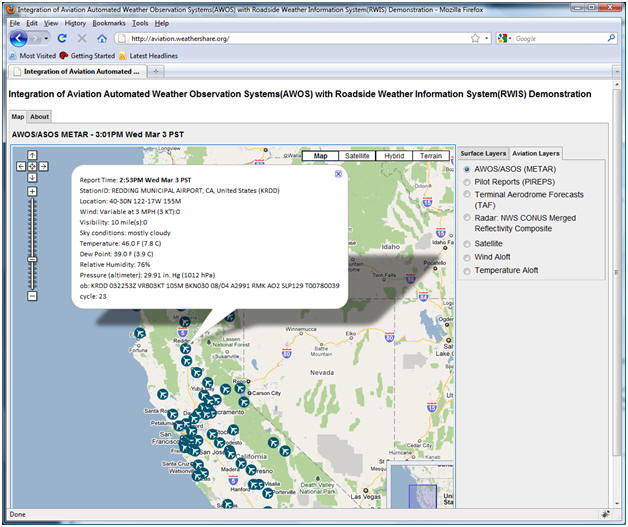
You can toggle different layers within the layers section on the right side of the interface. Here we've selected the Aviation Layers tab and then selected the AWOS/ASOS (METAR) layer. These readings should be familiar to most of users of the systems, particularly pilots - they're the readings from airports. We've selected the icon for Redding Municipal airport to display current conditions at that site. While there are a lot of AWOS/ASOS sites in California, there are many locations in the state that are relatively far from an AWOS/ASOS. That's part of the reason this application was developed - to supplement the information provided by AWOS/ASOS, and provide greater coverage, particularly in rural areas.
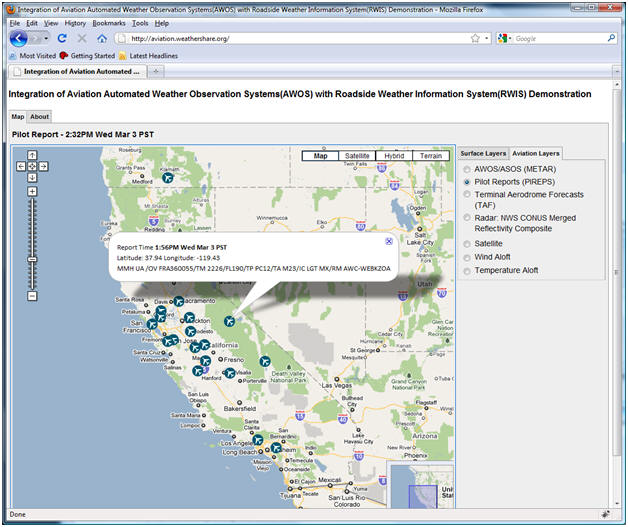
Here we've selected the Pilot Reports (PIREPS) layer. Note that in the prototype we've left the observations in encoded form. We realize these will be hard to read for the general user, and will try to provide something easier to interpret in the future.
Here is the Terminal Aerodrome Forecasts (TAF) layer, which also presents data in encoded form:

We use radar images from the National Weather Service, and on a day like today in which a storm is passing through, you'll see alot of activity:

Here we zoom in on the radar image to see more detail in the Sacramento area. Zooming and panning are done using the controls on the left side of the map. We're using Google Maps, so the interface should be familiar even to many first time visitors to our site.

Satellite imagery is also available. You'll notice that the satellite image completely covers the map. For this reason, we've included county outlines to help users orient themselves. You might find it useful to toggle back and forth between this layer and others, especially when zoomed in, to further help in pinpointing a location.

One of our favorite displays is the Wind Aloft forecast, also from the National Weather Service. This display shows forecast winds at different altitudes. WeatherShare users will find the display familiar. We use colored arrows to indicate direction and velocity, and when there is weather system passing through, the display is quite colorful. Here's the forecast for 3000 ft MSL:

Here we switch to 6000 ft MSL:

At 9000 ft MSL you can see some strong winds in the central portion of the state:

And, even more at 12,000 ft MSL:

At 15,000 ft MSL, the pattern is even more prominent. There are very strong winds in the central part of the state and generally along the Sierra-Nevada range. Note the counter-clockwise rotation with an apparent center in the Redding area. The center of the low-pressure system is moving across the northern part of the state.

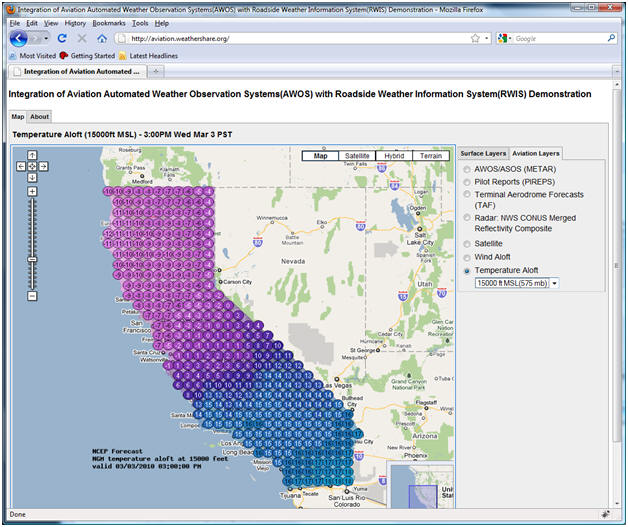
Temperature aloft is shown in a similar fashion:
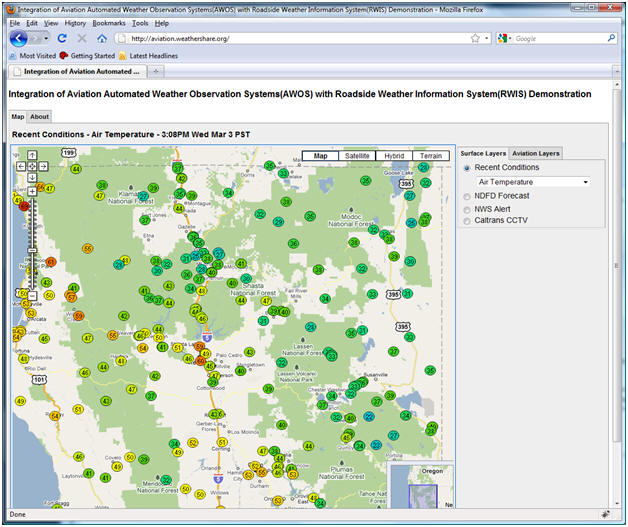
Here we return to the surface temperature display, to illustrate again how the system presents a unified view of surface and aviation weather information:
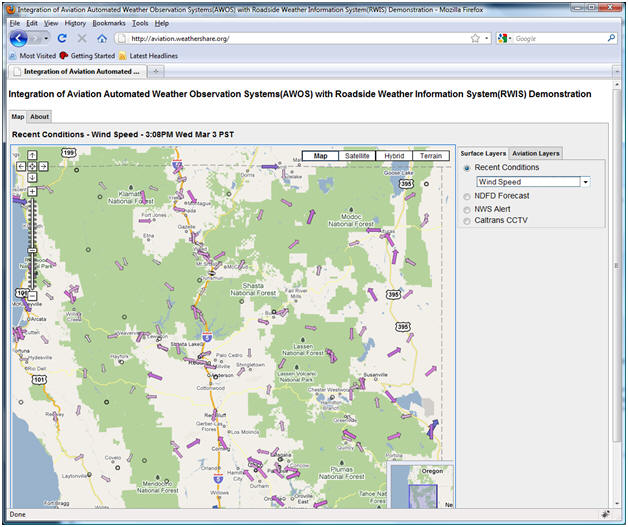
Other surface readings are available. Here we show wind speed. Note that conditions are relatively calm at this time in the northern part of the state.
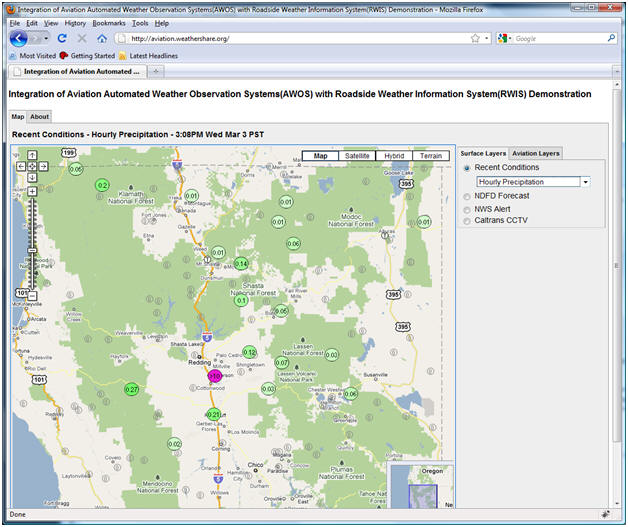
Precipitation readings are also available. Here we show readings from the past hour. Note that one sensor south of Redding may be reporting a faulty reading. While we perform error checks (quality control) on data in the system, errors in precipitation data are hard to catch because of the associated natural variability.
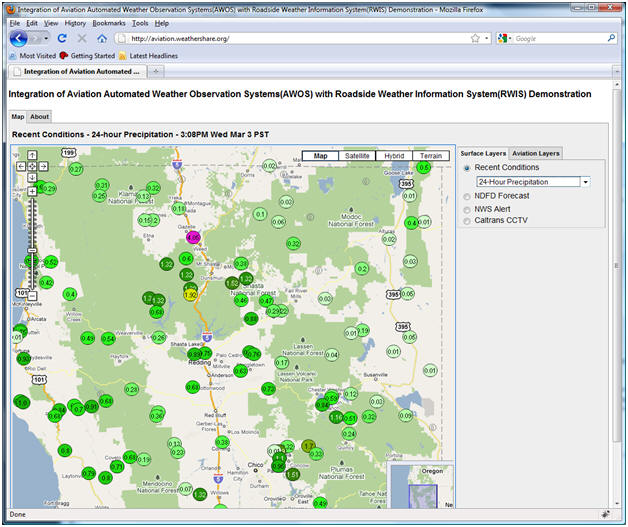
Twenty four hour readings are a bit more consistent than one hour readings:
Due to the variability in precipitation reported from sensors, we've included data from the National Weather Service to show estimated precipitation across the region for the past twenty-four hours. Note that this information is updated only once per day, in the morning.

We've included forecast data from the National Weather Service's National Digital Forecast Database (NDFD). Here we show forecast weather conditions for 4PM today. We've tried to maintain consistency with the National Weather Service for coloring and labeling so that users will find the display familiar and easy to read. It's easy to spot areas where rain an snow are predicted in this example:

Surface wind forecasts are also included. Note that we map surface icons along roads to provide greater detail for surface transportation. This does leave some gaps, as you'll notice in the following image over the Yosemite area:

Forecast snow amount is another colorful display. Amounts are forecast over six hour time periods. This same area will experience a significant amount of snow today.

Here's a display showing forecast precipitation across the state over the same time period:

And, here's another view of the snow forecast, this time for the entire state:

Visual observation is perhaps the best reality check for current conditions. We've included a Caltrans CCTV image layer for exactly that purpose. Here you see an image from Caltrans District 2 at the Bogard rest area. Sure enough, there's snow. But, you can see a patch of blue sky too!

There's no blue sky here. Another District 2 Camera shows snow and poor visibility on Siskiyou Pass:

The system wouldn't be complete without National Weather Service forecast information. Here's a forecast winter storm warning that is in effect through the night and into early morning tomorrow:

Fortunately, not every day is as interesting as today in terms of weather. You may not see as much activity when you visit the application web site. Please give it a try: http://aviation.weathershare.org/.

